Toronto Metro Map
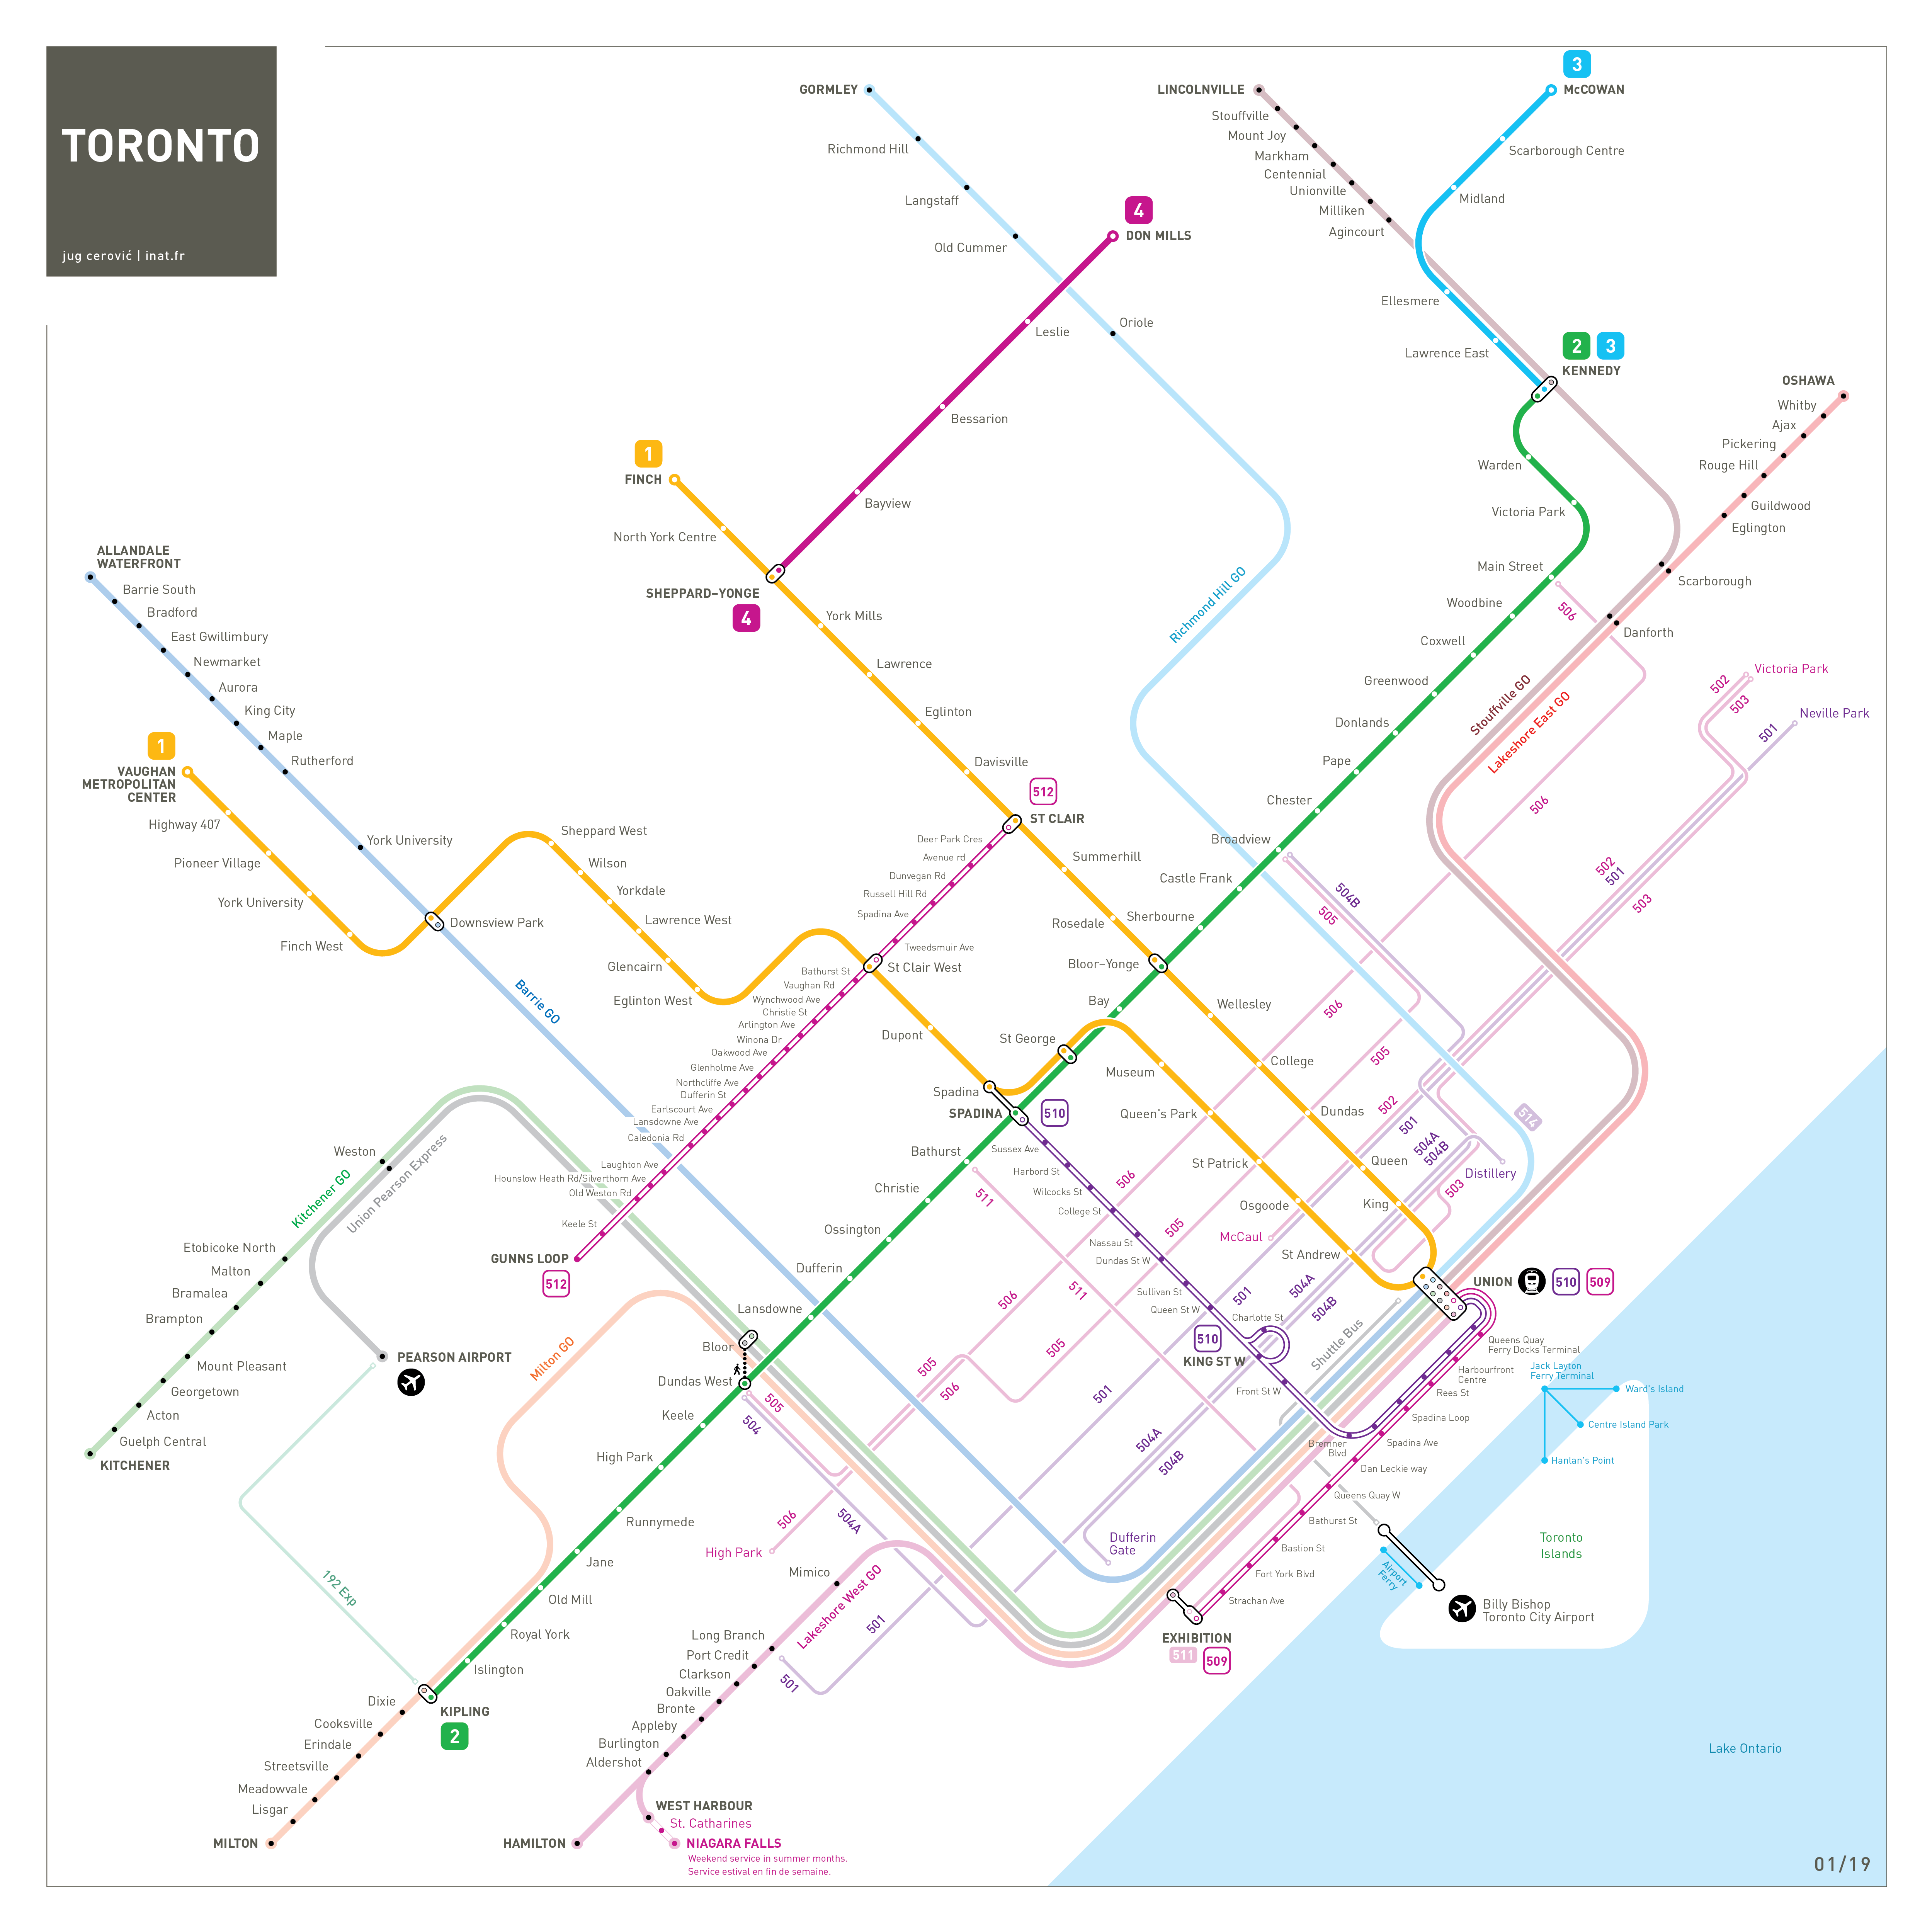
TTC Subway, streetcars and frequent buses
inat Metro Mapping Standard
2015
Print Shop

Art prints, posters, scarves, pillows...
DESIGN NOTES
Geography
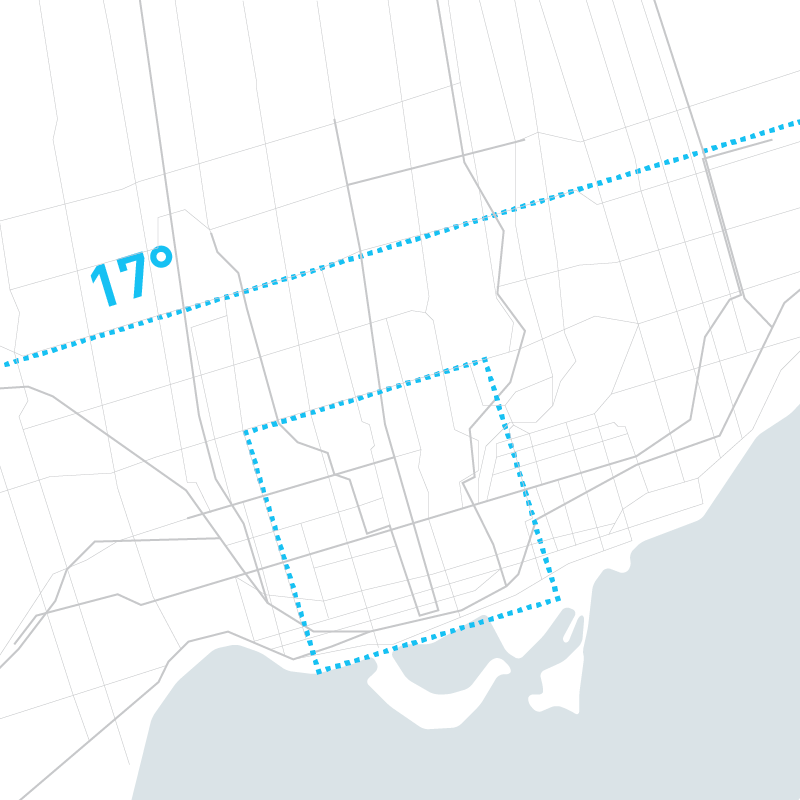
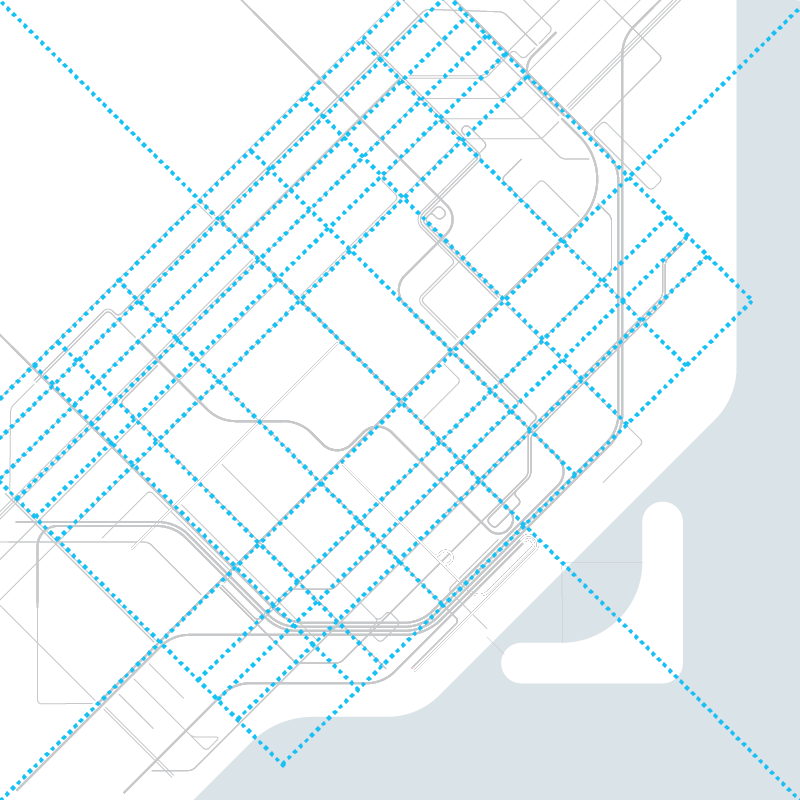
The map encompasses the entire area served by the metro system. All commuter lines in the area are also represented. The streets grid lays tilted 17° from horizontal.
Topology
Downtown area is enlarged (from St Clair Avenue to the lake )to make enough room for the display of all necessary information it contains. The periphery is consequently shrunk. Landscape features - lake shore, islands - are schematized.
Symbolism
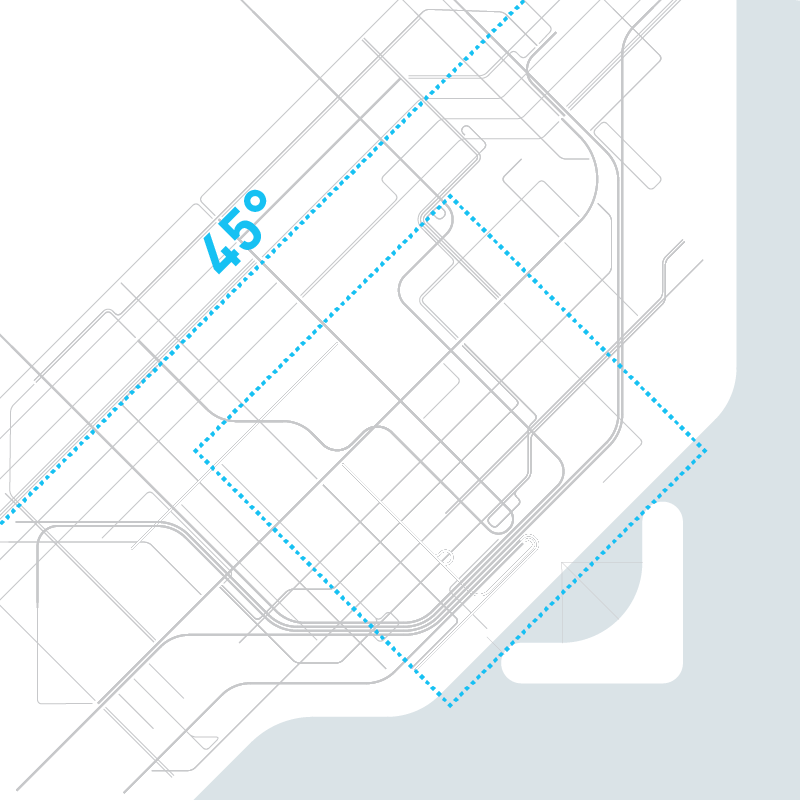
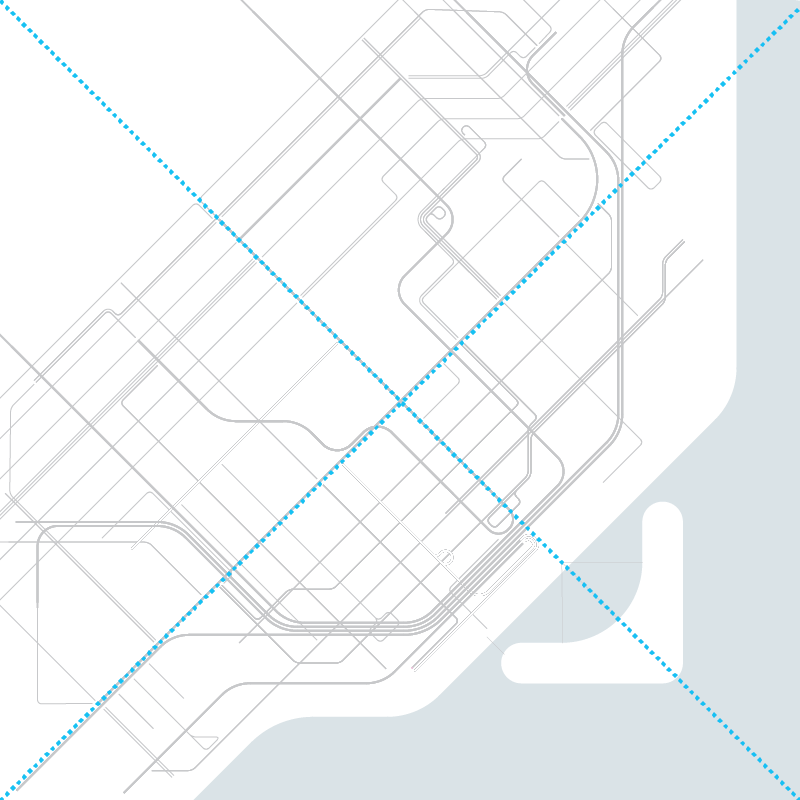
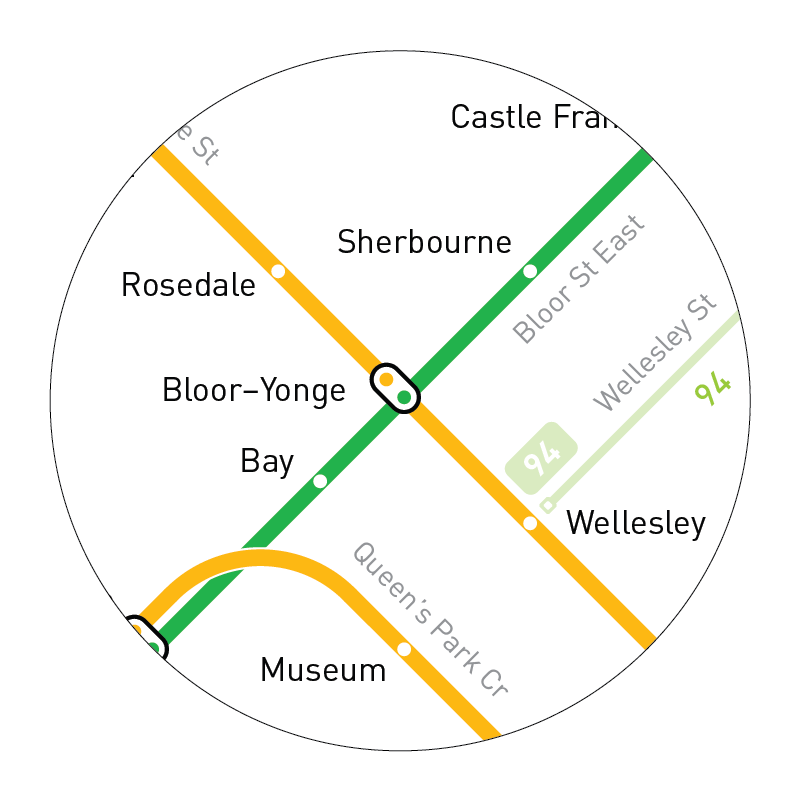
Bloor-Yonge intersection lays at the exact center of the map while Bloor and Yonge streets lay on the main diagonals.
Structure
Lines' shapes are simplified and organized following a regular grid formed by diagonals.
Hierarchy
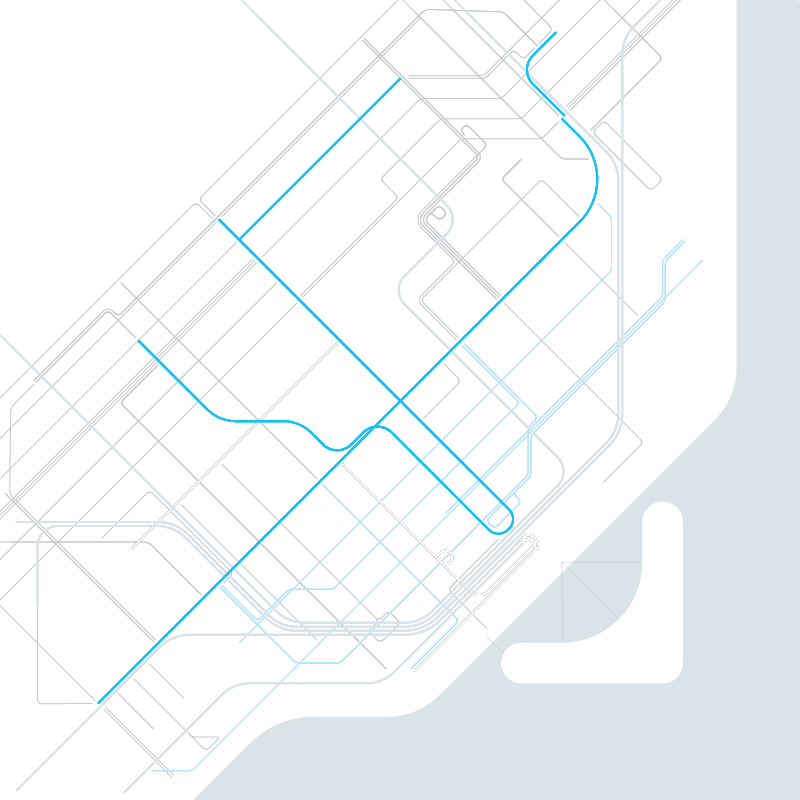
Transport systems are pictured according to their capacity and frequency:
Metro lines, high frequency and high capacity, are shown in outstanding bright colors with a thick stroke.
Go Transit lines, low frequency and high capacity, feature pastel colors and thick stroke.
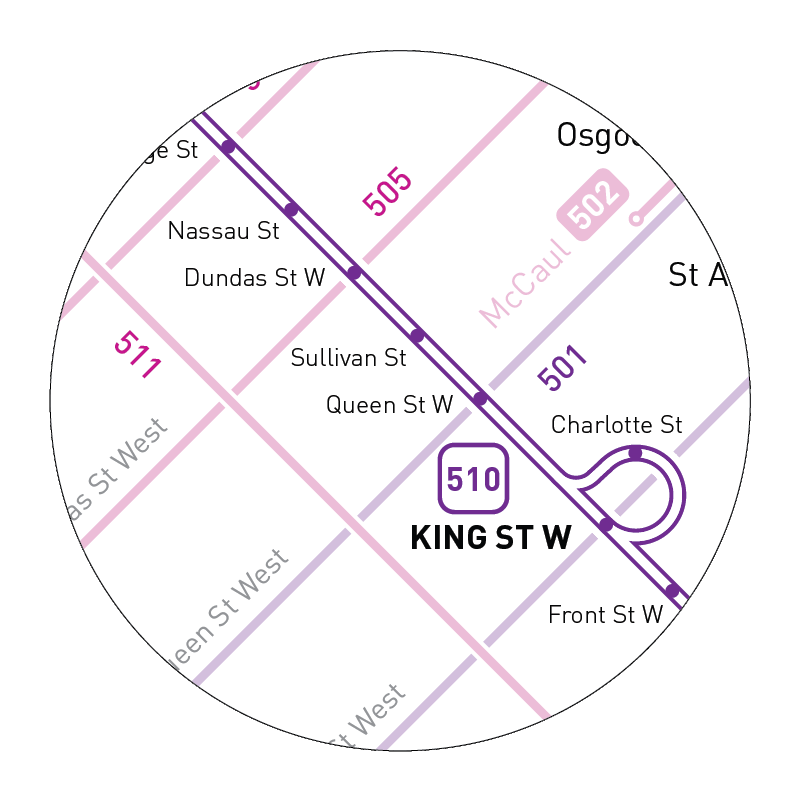
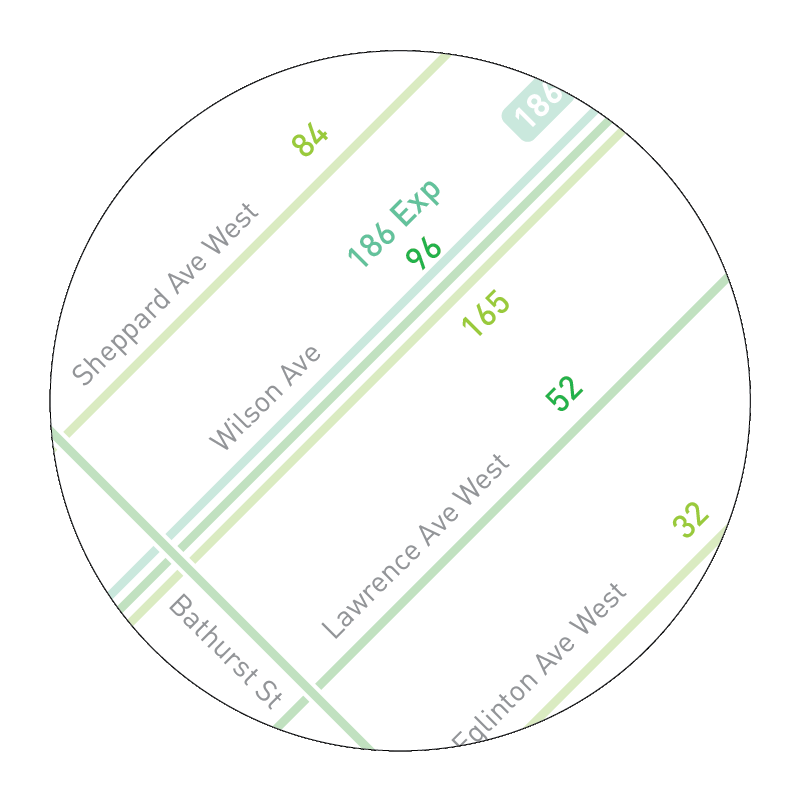
Lower capacity sub-systems have thinner strokes and dedicated colors, streetcars are purple/pink, buses are in shades of green.
Details
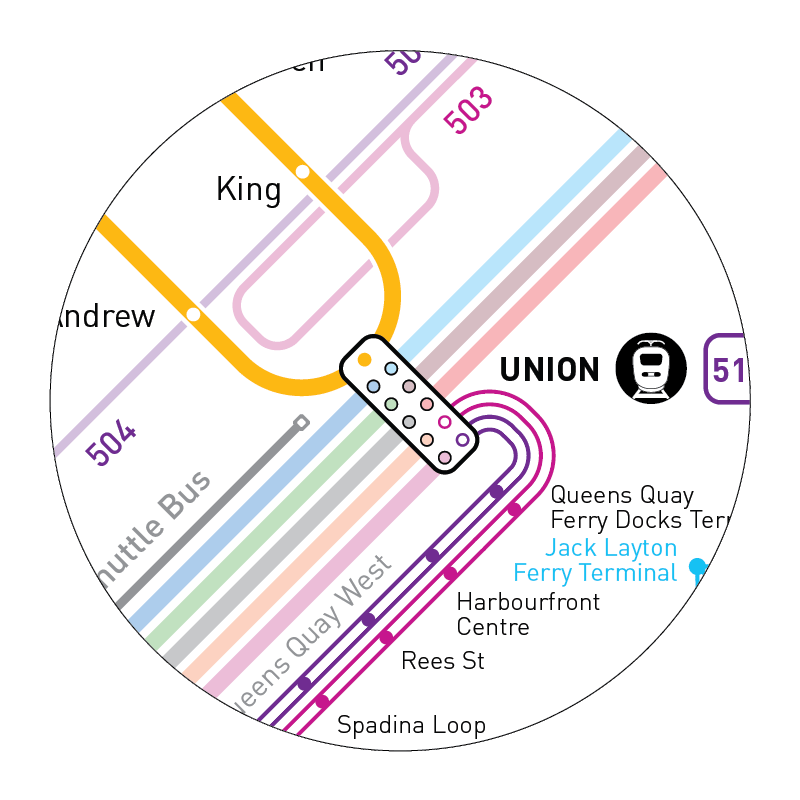
Bloor-Yonge intersection and Union Station
Streetcar and bus grids
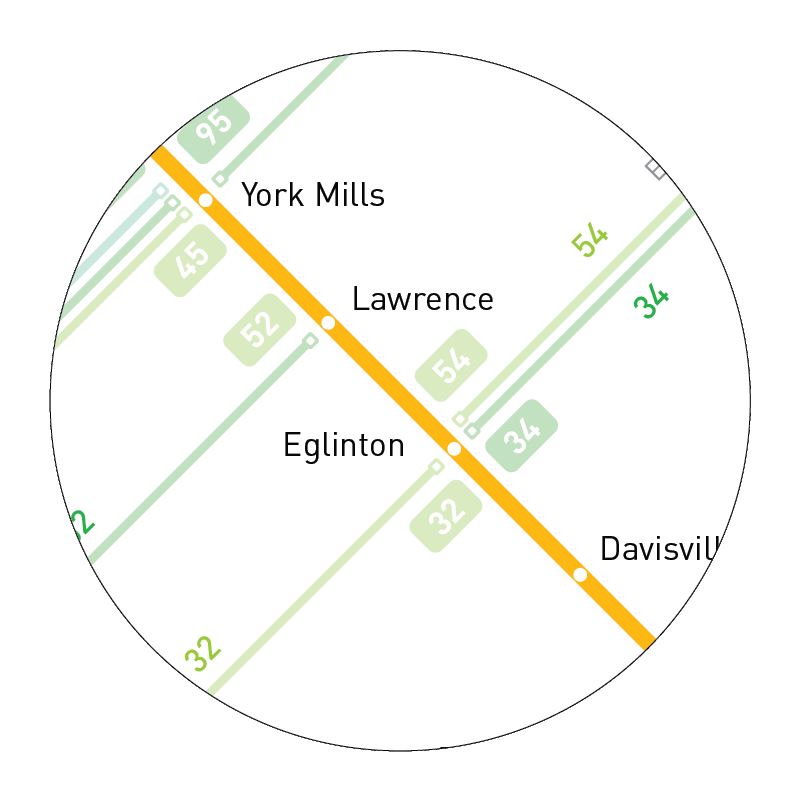
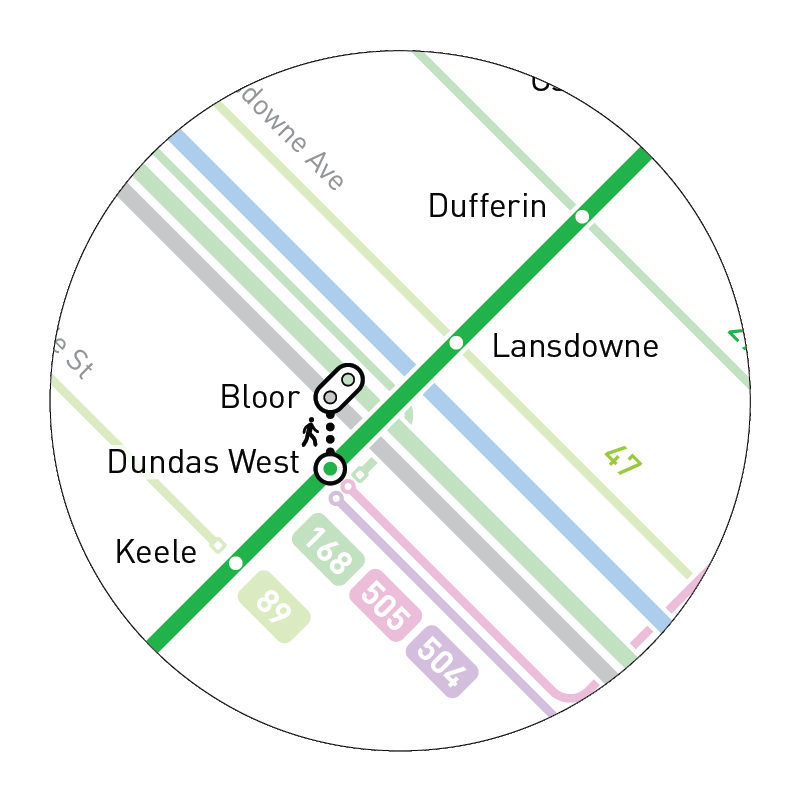
Eglinton station and Dundas West hub